Designed for HR professionals, SecureDB includes six (6) pre-built reports for understanding how your organization is using SecureDB. Those six reports are: Headcount, Attrition, Reviews, Profile Completeness, Needs Assessment, Composite Score. If your user role has the permission to access People Analytics, you’ll find it under People >> People Analytics on the left-hand sidebar.
IMPORTANT NOTE: Users with this permission can see everyone in an organization, regardless of Reports To structure.
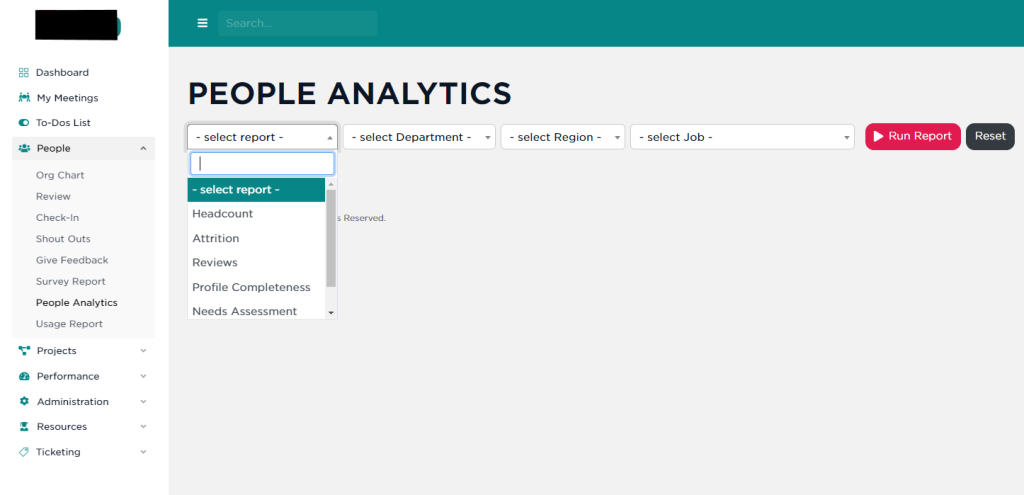
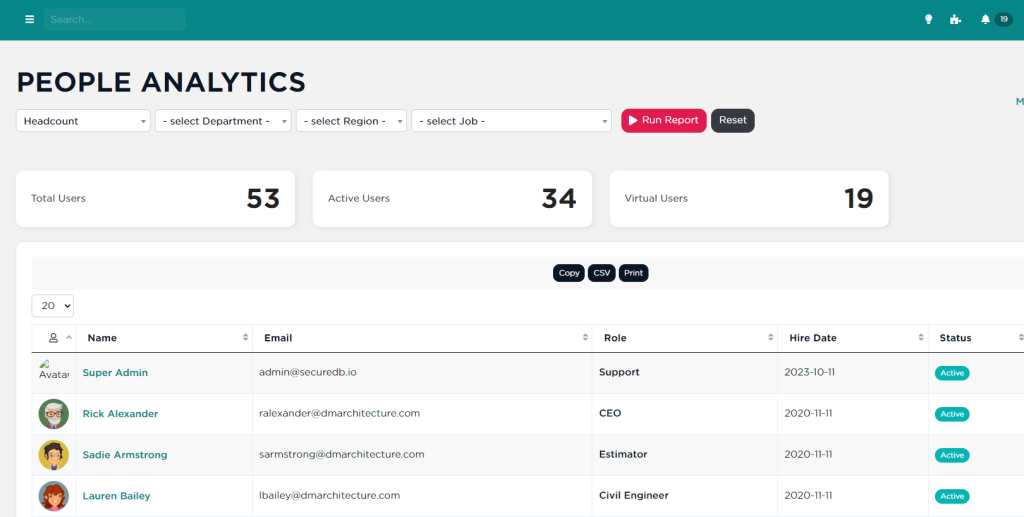
The Headcount Report
NOTE: Charts in People Analytics are coming soon.
- Select ‘Head Count’ from the list and click on
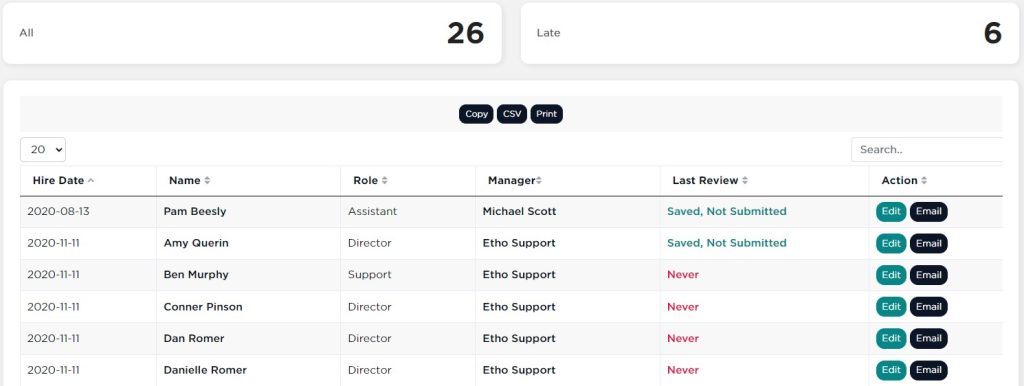
Run Report. - This offers a concise view of all users, their hire date, and current status.
- Options to edit profiles, send emails, and sort columns (by role, email address, or name) are available.
Below the trending chart (coming soon), you’ll find an interactive table you can sort, filter, and export as a CSV.
The Attrition Report
NOTE: Charts in People Analytics are coming soon.
- Choose ‘Attrition’ from the dropdown and hit “
Run Report'. - This displays a table containing only those users with a termination date.
- Especially useful if a terminated user hasn’t been set to ‘inactive’, which prevents access to Etho. The ‘active users’ count at the top should always read zero.
Below the trending chart (coming soon), you’ll find an interactive table you can sort, filter, and export as a CSV.
The Reviews Report
NOTE: Charts in People Analytics are coming soon.
- Select ‘Reviews’ and click
Run Report. - Monitor who might’ve missed a review, hasn’t had one, or has saved but not submitted one.
- This table also shows the manager’s name for easy communication.
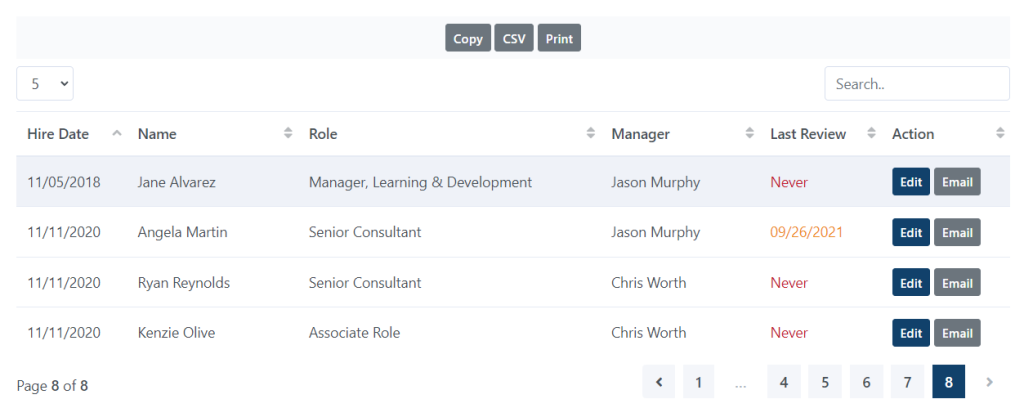
Below the trending chart (coming soon), you’ll find an interactive table you can sort, filter, and export as a CSV.
The Profile Completeness Report
- Choose ‘Profile Completeness’ from the dropdown and hit
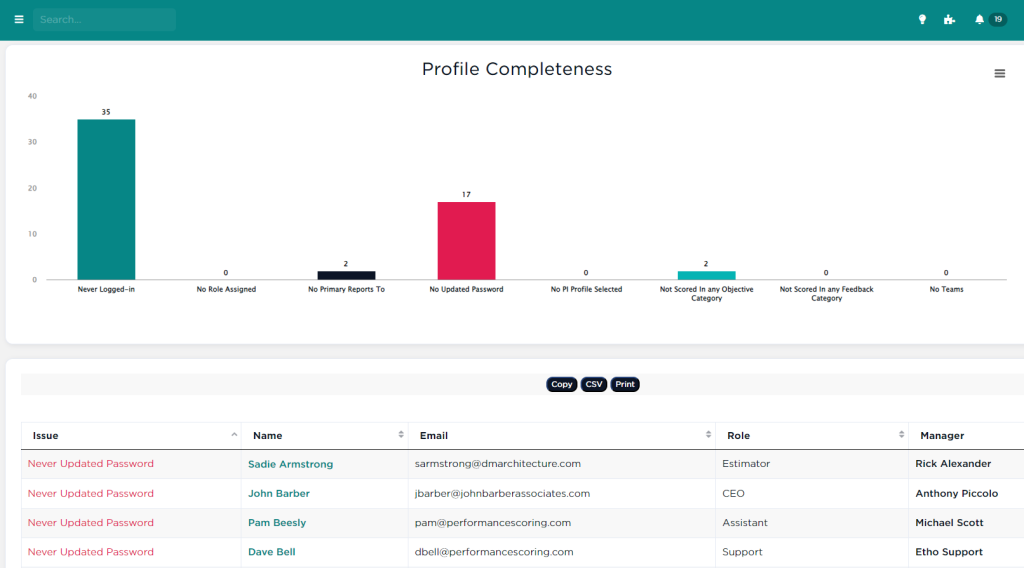
Run Report. - Invaluable for the implementation and support teams, it evaluates the organization’s onboarding progress.
- The report runs multiple checks on every user, offering an overview of Tasks they haven’t completed, from not logging in to not updating passwords or being unscored in various categories.
Here are the rules this report loops through.
- Has Never Logged-In (critical)
- Has No role Assigned (critical)
- Has No Primary “Reports To” Selected (critical)
- Has Not Updated their Temporary Password (major)
- Has (if enabled) No PI Profile Selected (major)
- Has No Feedback Categories “Is Scored In” (minor)
- Is Not on Any Team (minor)
More information about these rules can be found here.
The Needs Assessment Report
- Select ‘Needs Assessment’ from the dropdown.
- Choose the relevant review quarter, for example, Q2 2022, and click
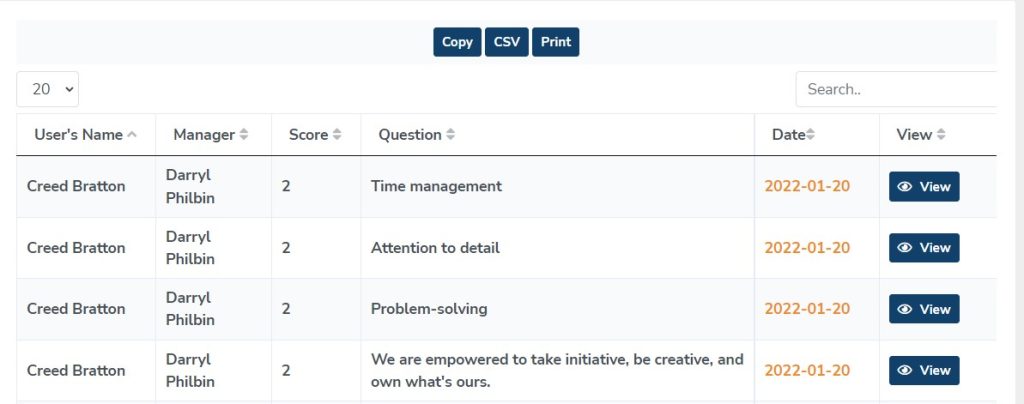
Run Report. - This provides a comprehensive report of users who scored three or below on specific questions during the selected review period. Sorting by score can highlight areas for improvement.
Here is the information that is returned for each result:
- User’s Name (First Last)
- Manager (who did the review)
- Score (the score if it was “3” or less)
- Question (the question that was scored a 3 or less)
- Date (the date the review was submitted)
- View (a link to the archived-readonly review)
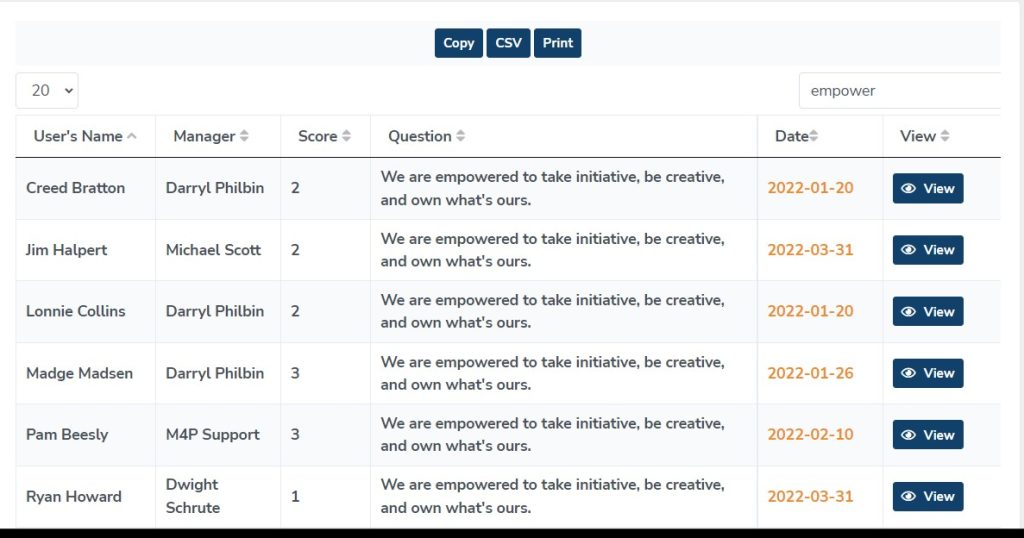
This gives Managers a quick way to see where employees may be struggling, and identify key areas to coach them to success.
Composite Score
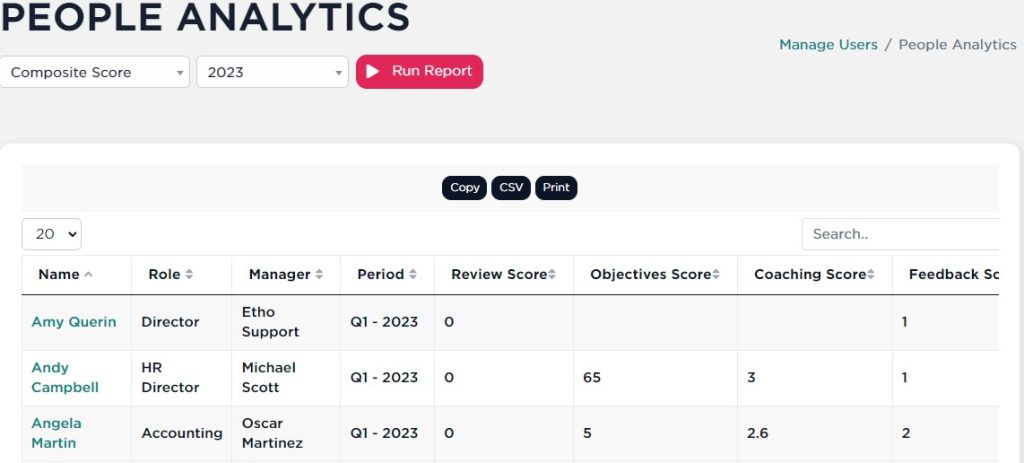
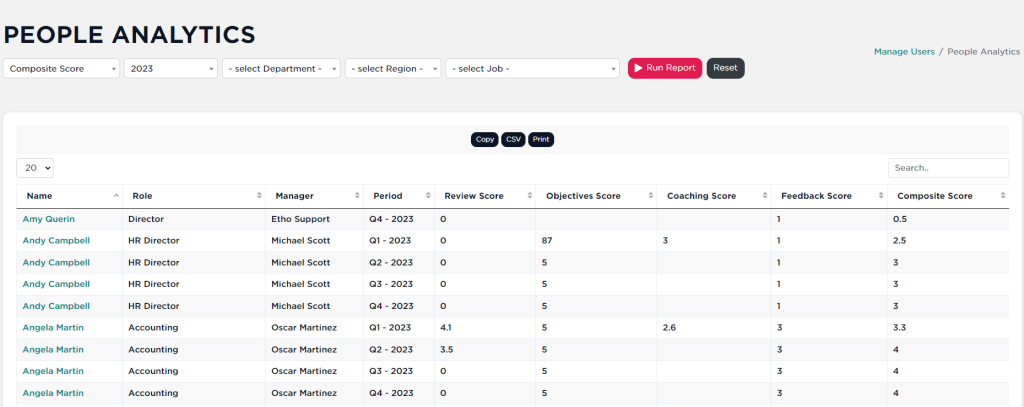
Composite Score includes each individual within your organization’s average scores across Reviews, Factor and Objectives. It also includes the average of all those scores in that period–the “Composite” score (because “Average Score” sounds blasé).
- Select ‘Composite’ from the dropdown.
- Select the year, and Click Run Report
- You’ll be presented with a sortable and filterable table with the scores for each individual as well as an average of all the scores in the row, shown in the last column
More to Come
We have plans to add more pre-built People Analytics reports. We’re also planning on adding the ability to build, save, and share your own custom People Analytics reports.
