Customized Scorecards can be added to any meeting allowing attendees to view Objectives specific to the meeting’s purpose . Objectives can be added directly to existing Scorecards or through the meeting’s settings. Here’s how.
Adding a Scorecard to a Meeting
To add a Scorecard to a meeting, access the meeting’s settings via the settings icon on the My Meetings page or the Meetings widget on your Dashboard. Once in the meeting’s settings, scroll down until you see the Scorecard section, toggle it on, and you will see 3 options for adding Objectives to the meeting:
- Objectives Categories: Add all Objectives in that category for the users listed in the Attendees section.
- Specific Objectives: Add individual Objectives for the users listed in the Attendees section.
- Individual Objectives for Non-Attendees: Add individual Objectives for the users NOT listed in the Attendees section. Useful for analyzing Objectives of employees who don’t need access to the rest of the meeting agenda.
Once you have added all of your Objectives, scroll to the bottom and save the meeting’s settings.
Interacting with the Meeting Scorecard
Within the meeting, navigate to the Scorecard section, and you’ll see the Objectives added to the meeting filtered by the meeting attendees who have accepted the meeting. The Scorecard comes in two flavors: mobile and desktop.
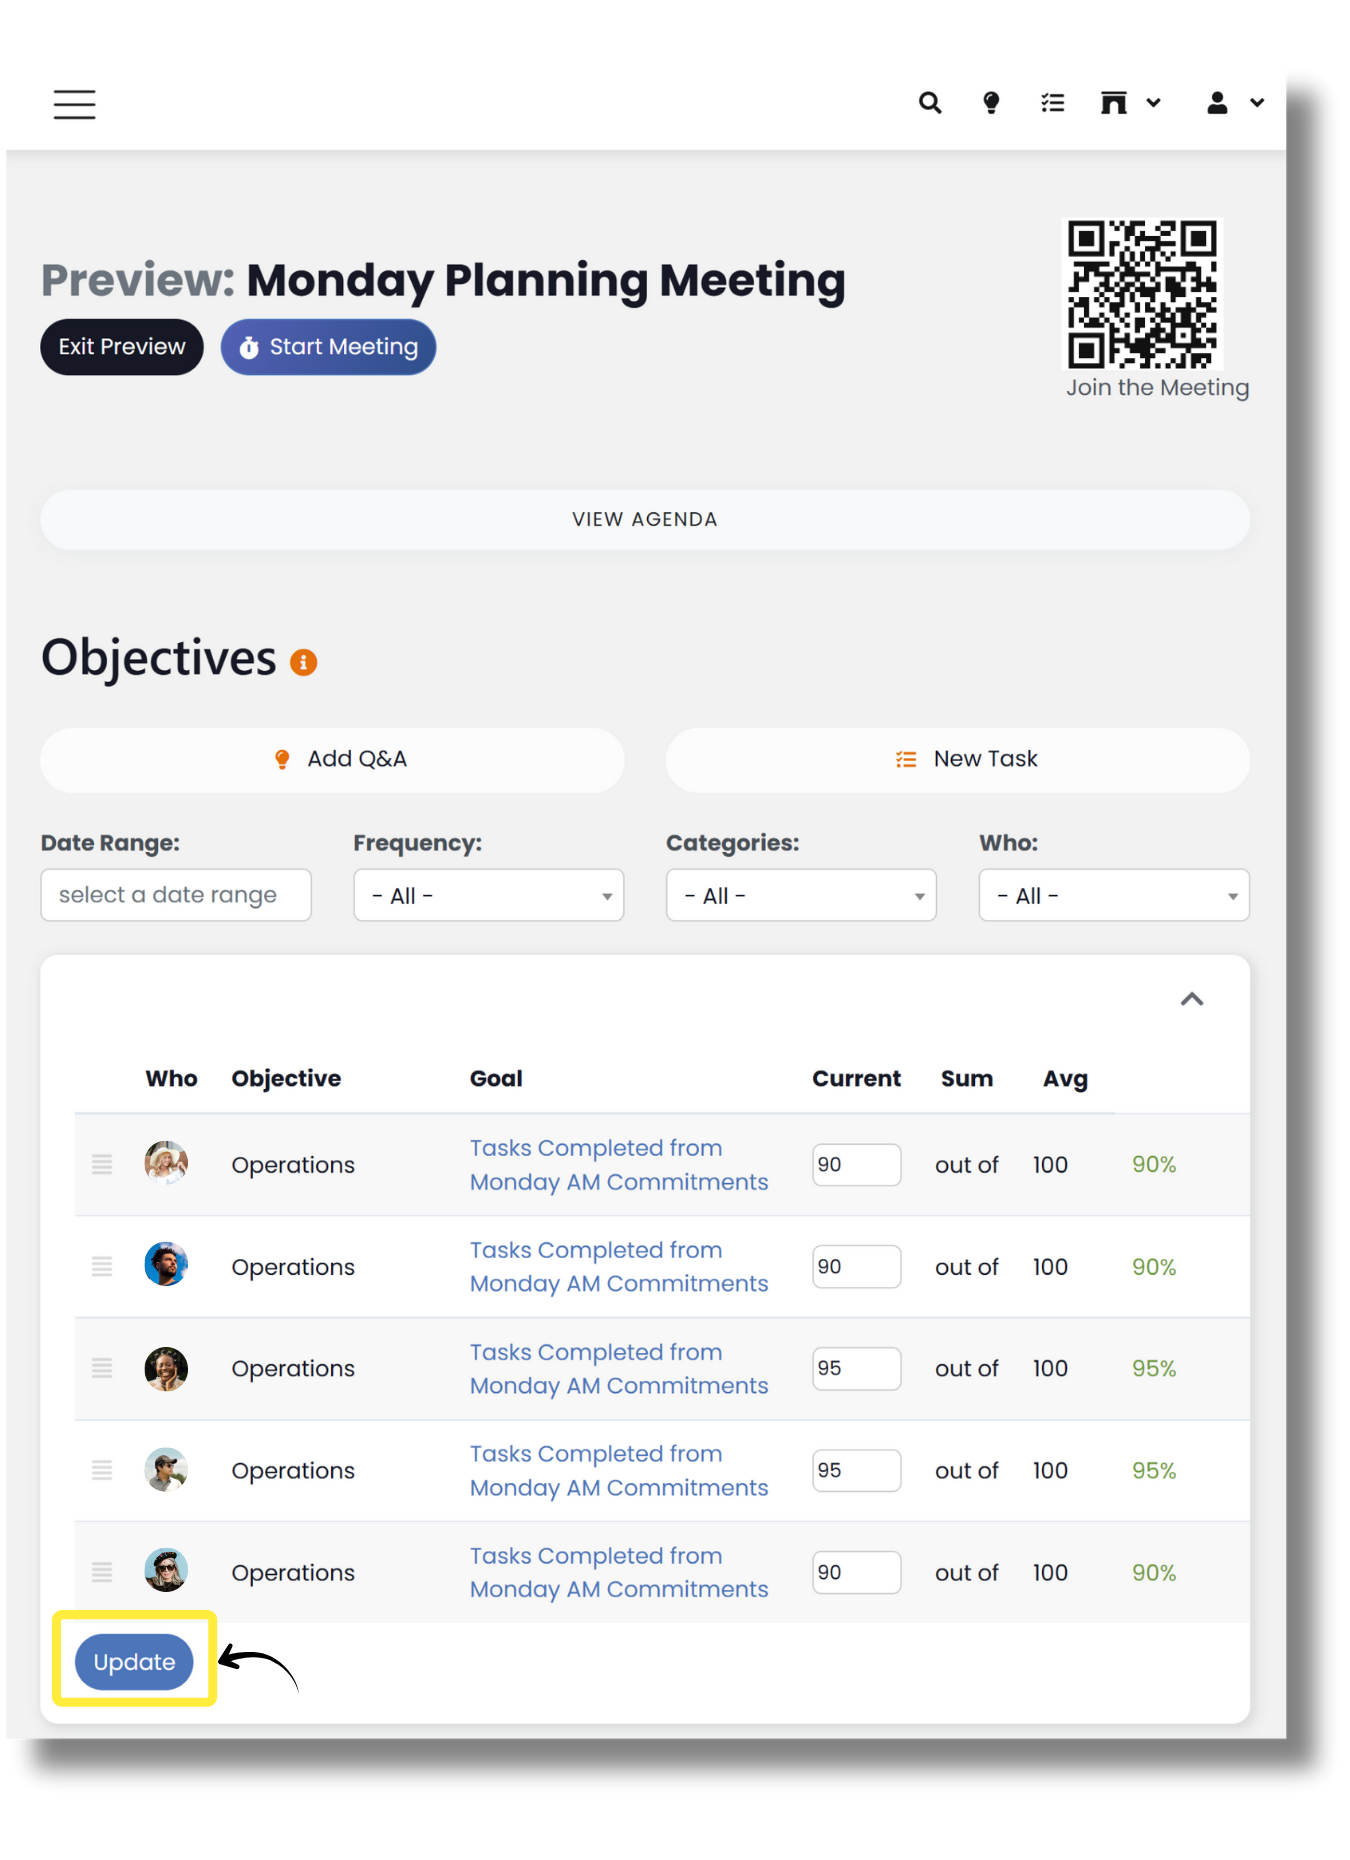
When viewed on a mobile device, the Scorecard only shows the most recent data in a table with an “Update” button at the bottom.
When viewed on larger screens, the Scorecard expands, showing boxes for each data point that can be updated.
NOTE: Your user role MUST have the permission “Edit Historical Objectives” turned on to edit Objectives in columns prior to the current one.
Above the Scorecard, you will see filters for Date Range, Frequency, Category, and Who that allow you to quickly view different variations of the Scorecard.
Scorecard Layout
Within the Scorecard, you will see a row for each Objective. Moving left to right across rows, you’ll see the following:
- The “grip” for re-ordering the rows
- Avatar of the user to which this Objective is assigned
- Objectives category (only seen on very wide screens)
- and the Objectives name. The Objective name may be abbreviated if it is very long. To see the whole name, hover over the title or click the title to see the whole name in a modal window.
- Objective orientation and value(s)
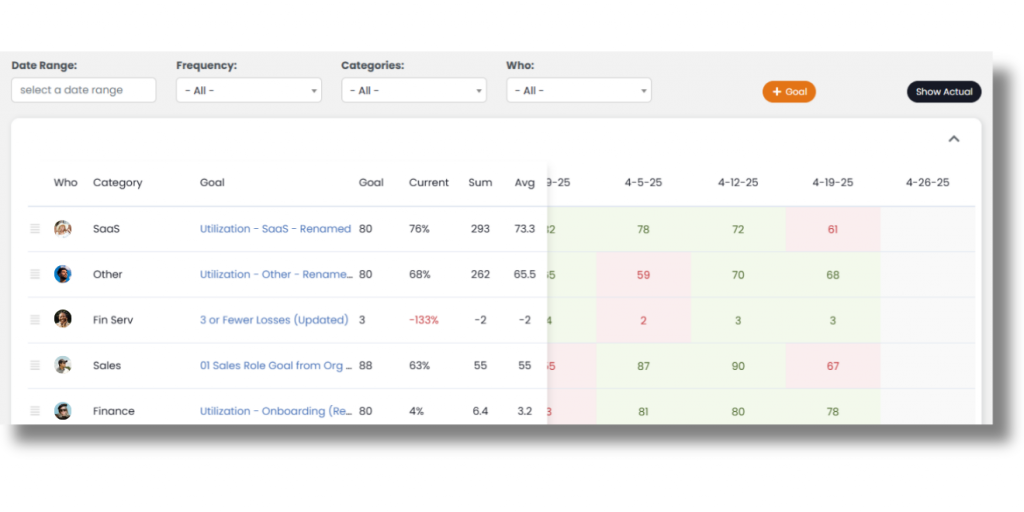
- Current score for the Objective. The default view is the percent of the Objective reached, but you can toggle to the actual number by selecting “Show Actual” to the top right of the line chart.
- Sum and average scores automatically calculated for each row visible in the current date range.
- Objective values. Values for each Objective for the respective frequency period selected.
Entering Data
A sliding table sits behind the left side of the table and displays Objectives for the selected frequency; columns also match the frequency. The column all the way to the right is the most current period. Tiles will be green if they match the desired value(s) of the Objective, and tiles will be red if they are not within the desired value(s).
Each time you click away from a table cell, that new value is saved. That’s why there is no “Update” or “Save” button when the Scorecard is viewed on a wide screen.
Each time you click away from a table cell, that new value is saved. That’s why there is no “Update” or “Save” button when the Scorecard is viewed on a wide screen.
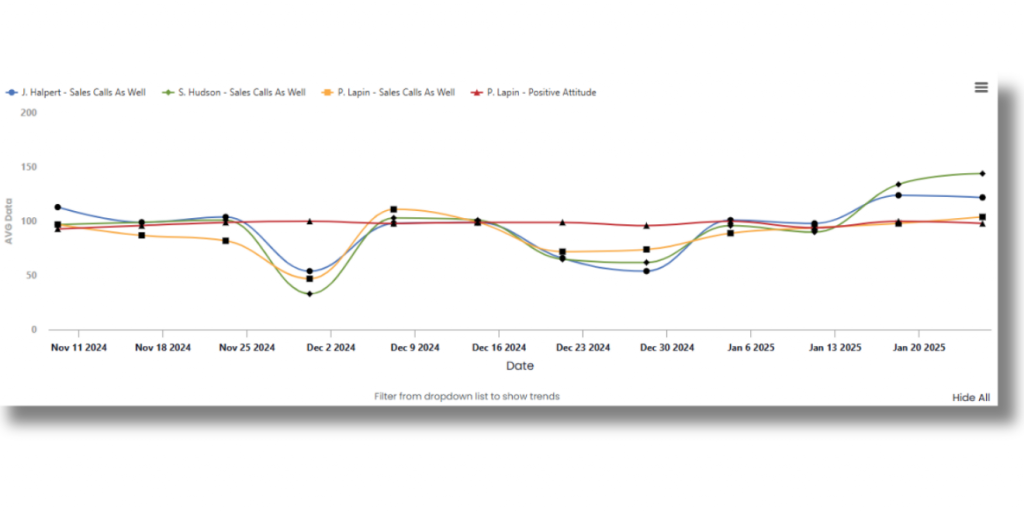
The Objective trend chart below the table shows the same Value over time and respects the filters chosen. Click and drag the chart to zoom-in to a specific period.
Next up: Initiatives, Projects, & Tasks in Meetings


