If enabled in your user role, you will have the option to “Visualize” Projects. This pulls up an interactive Gantt chart.
NOTE: If no Initiatives are present in Administration >> Meeting Settings >> Initiatives tab, then “Visualize” is not an option in the main navigation.
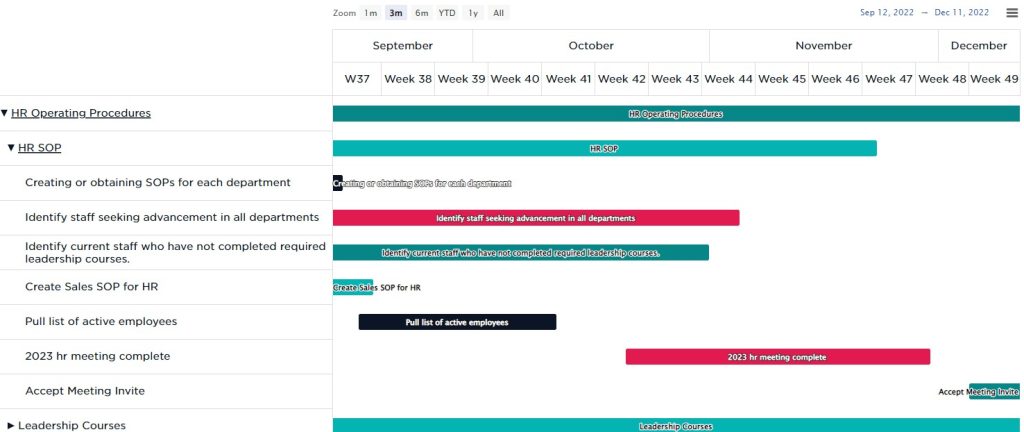
A Gantt chart, commonly used in Project management, is one of the most popular and useful ways of showing Initiatives, Projects, and Tasks displayed against time. On the left of the chart is a collapsible list of Initiatives, Projects, and Tasks and along the top is a time scale.
Each activity is represented by a bar; the position and length of the bar reflects the start date, duration and end date of the activity. There is a vertical line representing the current date (today). Each bar gets darker as its progress towards 100% increases.
This allows you to see at a glance:
- What the various activities are
- When each activity begins and ends
- How long each activity is scheduled to last
- Where activities overlap with other activities, and by how much
- The start and end date of the whole Project
All high-level Initiatives are open by default. Each Project within that Initiative is collapsed by default. Click the Project name on the left to expand it into each of the Tasks associated with that Project.
Navigate across time at the bottom and zoom in or out to change how you’re viewing the chart. At the top-right, you have a few options for exporting. At the very bottom, there is a grey button to export the chart, in its current view, as a PDF.
You can drag & drop each Project or Task to change its start and end dates. Grabbing the ends and dragging them will also update that Task or Projects dates.
Love Charts?
If you like interactive charts like this, you’ll love our Project Reports too.


