In SecureDB, Projects are a way of grouping a series of Tasks that are all interrelated. Projects, themselves, have a start date and a deadline. They have Creators, Team Members, and Viewers. Let’s go through a high-level overview into what all this means, how to use it for Project Management, and all the ways Project status can then be communicated elsewhere in the application.
Creating a Project
If your role has the permission “Create/Edit Projects“, you’ll see “Projects” in the main navigation. Click on “Projects List” to see all the current Projects you have access to see.
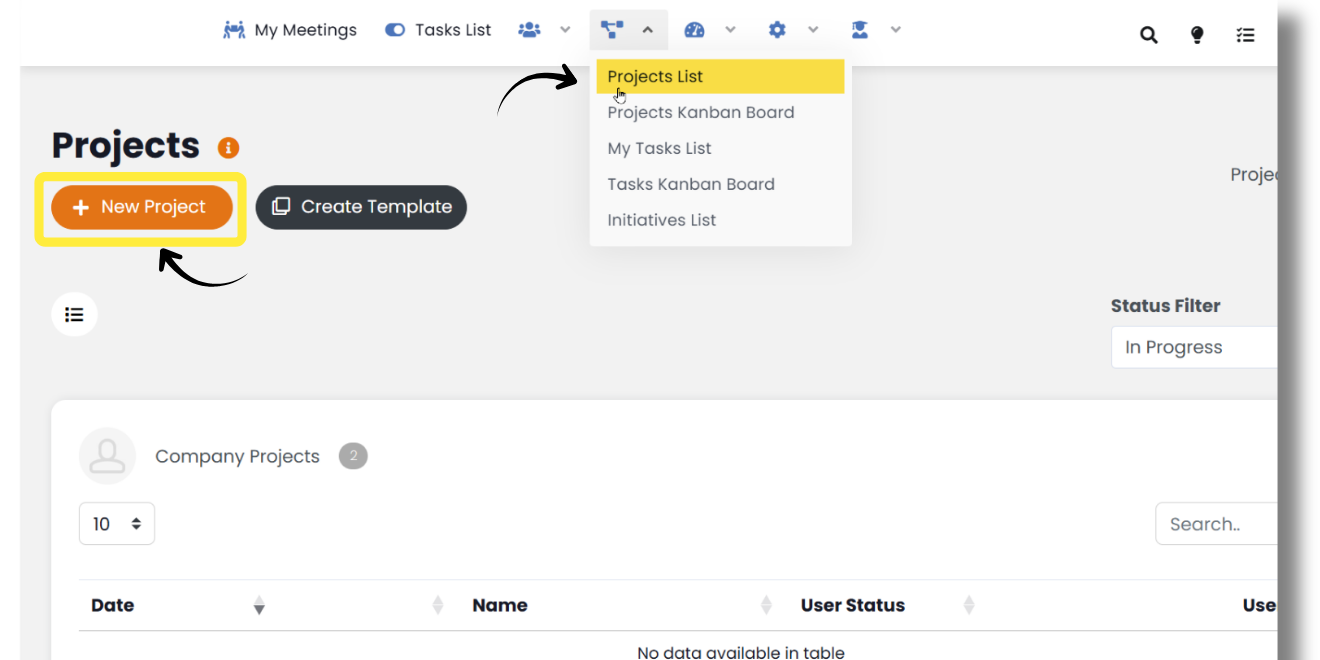
At the top, click New Project to create a new one.
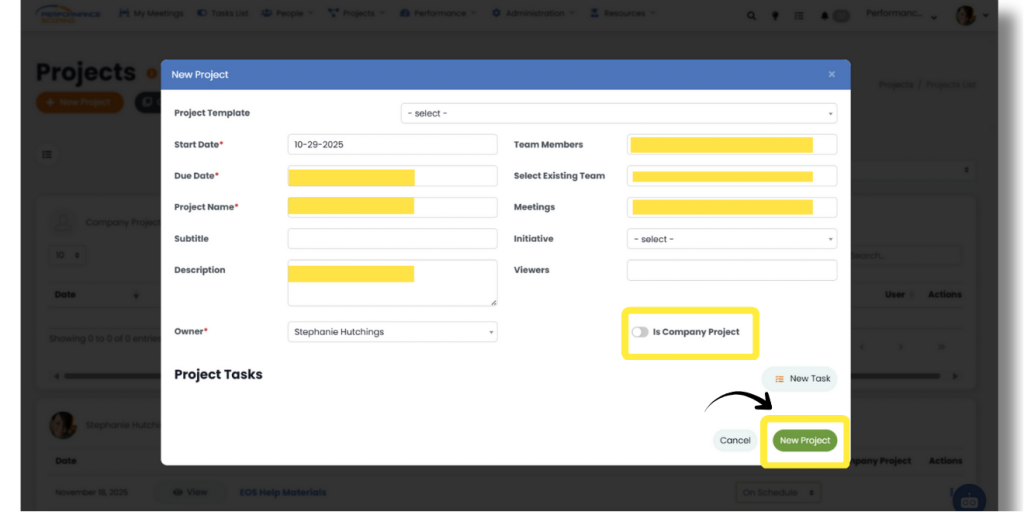
Enter your new Projects start date (defaults to today’s date), a deadline/due date, give it a short name as well as a shorter subtitle name (optional). Then, give the Project a high-level description.
If you plan on having “Project Meetings”, enter the screensharing URL in the “Meeting URL” field.
Select the “Owner” of the Project. The Project Owner is the person ultimately responsible for the Project. Keep in mind that the Owner is not necessarily actually ON the Project team.
Select users from your organization who should be able to “see” the Project and its details, but are not actually working on the Project in the field, “Viewers”.
Select all the individual “Team Members” who will actually be working on the Project. In this field we can select any individual. In the next field, we could choose an entire Team that’s already been created. See “Creating Teams” for details about how to create these groups of individuals. You might want to go ahead and add yourself as a Team Member on the Project.
If you already have some meetings that you know will need to report on this Project, you can go ahead and add this Project to those meeting agendas from the “Meetings” field.
Lastly, managers with the top-level access permissions should have setup “Initiatives” in Global Project Settings. In the last field, select the Organizational “Initiative” you feel this Project is most likely to work towards achieving.
Don’t worry too much if you’re not sure which one to choose. Initiatives are buckets of Projects and Projects are buckets of Tasks. Together, they’re used in Gantt Charts, and the Project Reports drilldown chart.
When you’re done, click the New Project button at the bottom.
Add Tasks to Your Project
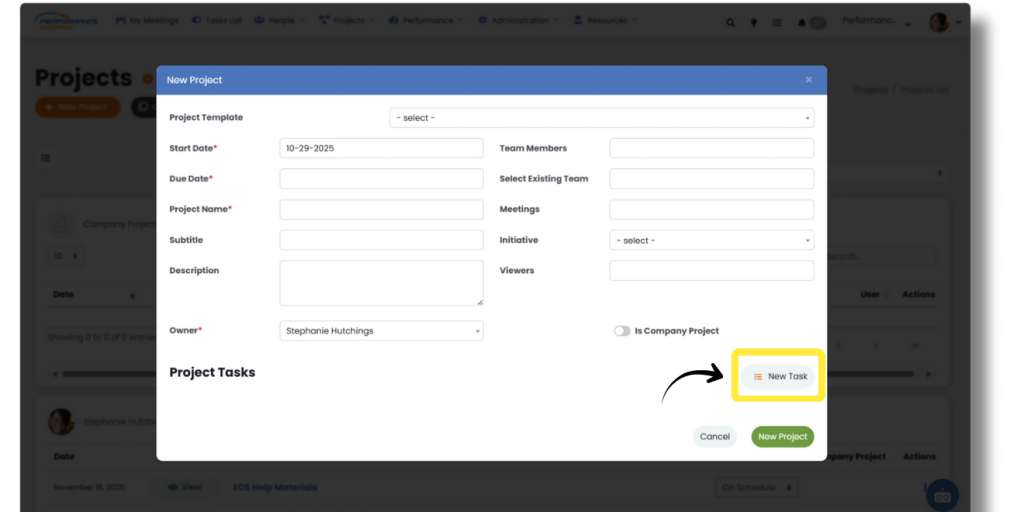
Now that we have our new Project created, we need to add some Tasks to it. Click on the Details button on the newly created Project and then click New Task to start creating Tasks for the Project.
These Tasks do not have to be perfect. You don’t have to get the start and end dates perfect. Think of it as an exercise in breaking this big Project into smaller parts and assigning those smaller parts to the appropriate people associated with the Project.
Project Management
Now that you have all these different Tasks associated with your Project and “ownership” of each Task delegated, allow your people to write-up the sub-Tasks you feel need to be completed. Those “sub-Tasks” could be written-out inside of each Tasks “details,” or broken into their own, separate Task.
Each Task in the list has, essentially, three states: Not Started, In Progress, Complete. Click the first check box to mark that Task in progress. For mathematical reasons, that Task is now worth “50%.” Then, click the second check box to make that Task Complete. Complete Tasks are considered to be worth “100%.”
Then, ALL the Tasks within your Project‘s “completeness” are added up to determine the total Project completeness. The “On-Track” and “Off-Track” status is calculated based on today’s date along the continuum from the Project‘s start to end dates. The calculation is a little complex for this article. Here’s a simplified explanation.
Let’s say you have a 6-week Project. If “today” falls in the middle of that Project, we’re assuming you should be about half-way done (50%). If the actual percent complete of all Tasks within the Project add up to significantly LESS than 50% done, the Project is considered “Off-Track”, otherwise, it’s considered “On-Track”.
Don’t agree with the math? That’s ok. It’s possible there’s not an fairly even distribution of Tasks within the Project. In Meetings where the Project is included in the Agenda, you’ll find an editable dropdown where you, the Project Owner, can select things like “Progressing as Planned” to communicate to others the Project is in little or no danger. We call those “feelings.”
Project Reports
The status of each Project is automatically reported in all sorts of ways. Let’s review three of them.
Project Status Review in Meetings
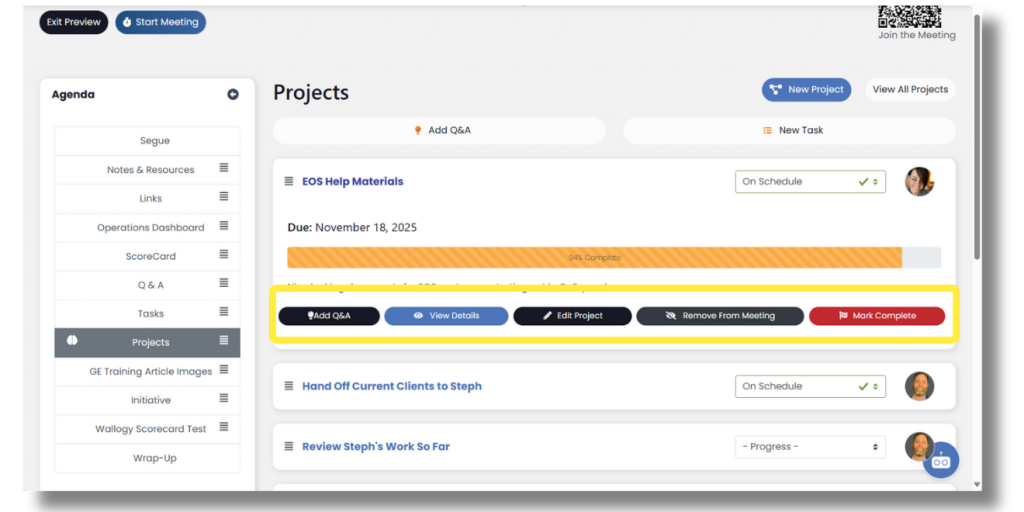
As we mentioned before, Projects that have been added to Meetings will appear in the meeting agenda. Each Project‘s percent of total complete is listed as well as how the Project Owner is feeling about its progress. There’s a “View Details” button to open a new window to drilldown into specific Tasks inside the Project that may require attention.
Project Reports
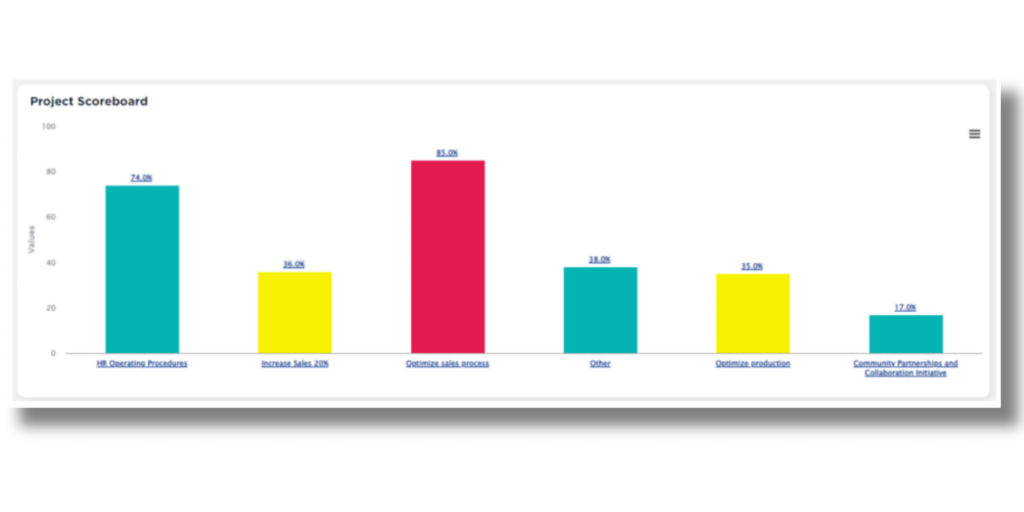
Project Status is also shown in Project Reports for those who have that permission in their role. These include a stacked bar chart listing the number of Tasks assigned to each employee by status. There is also a drilldown column chart showing the Initiatives, Projects within those Initiatives, down to the Tasks within those Projects.
Gantt Chart
There is also a report which collapses Projects and Tasks into Initiatives and overlays them in a Gantt Chart. Click the “>” chevron on the left to expend/collapse each. If you drag & drop them horizontally, it’ll automatically update the start and end dates for you.
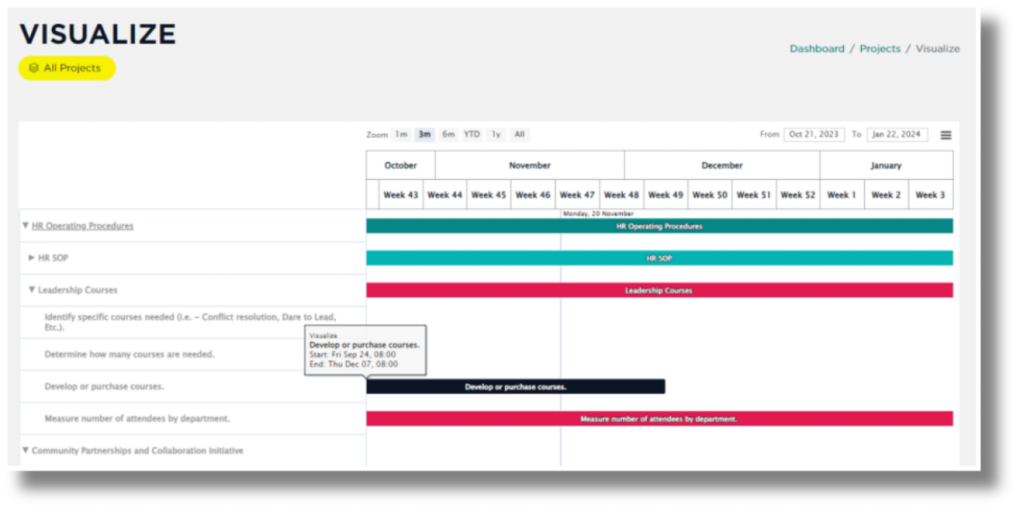
The vertical blue line indicates today’s date.
Love reports? There are a LOT more available to managers. Let’s take a look at a few next.
UP NEXT: Reports


