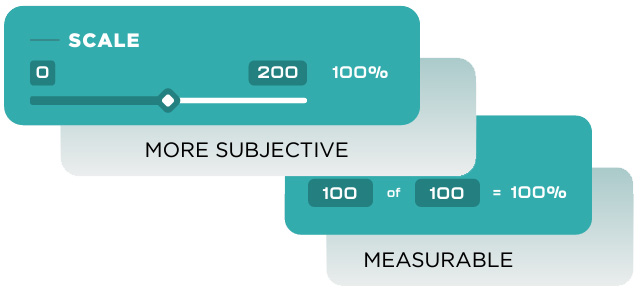
By default, Team Objectives sum to a total on the Team Dashboard for all members of that team. However, if the Unit for that Team Objective is set to a Percent, we average them instead. Otherwise, we’d end up with a team objective of 100% for each team member and, if there were 5 team members, the “team goal” would be 500%–which makes no sense.
Why did we do it this way? Let’s look at two examples.
Team Objective Unit is an Integer
- There are 2 people on the “Widget Team”
- The Widget Team’s objective is 100 widgets created per team member (unit is “integer”)
- Jim has created 120 (that’s 120/100 = 120%)
- Bob has created 12 (that’s 12/100 = 12%)
- On the Widget Team Objective, it will show how the team as a whole is doing: 56% (12+120 / 100 + 100)
In this way we can look at an overall team and see how the group is doing. To see which individuals are high-performing, and which are not (looking at you Bob), look at the Team 2×2 to the left of the team dashboard. You can also drilldown into individual employees on that team from either the Accountability Chart or the Dashboard.
Team Objective Unit is a Percent
- There are 2 people on the “Writing Team”
- The Writing Team’s objective is 100% utilization per team member (unit is “percent”)
- Jim is at 150% utilization
- Bob is at 5% utilization
- On the Widget Team Objective, it would show the AVERAGE for the team: 77.5% utilization
Once again, we can look at the team as a whole, as well as drilldown into the individuals on the team. We just wouldn’t want the percentages to add up to 155% out of 200%.
That’s why these are a little different.


