As with the rest of the GoExpand application, we aggregate granular information into high-level reports so you can get a visual overview of how Rocks are coming with our Rock Reports.
If your user Seat has the permissions “Access Rocks“, and “View Reports”, you’ll see an option under Rocks called “Rocks Reports”. Go there to access the Rock ScoreBoard and view To-Do numbers broken down by member.
Rock ScoreBoard
At the top of Rock Reports, you’ll find a drilldown column chart of all your 1 and 3 Year Goals, Rocks, and To-Dos. This chart works similarly to the ScoreBoard drilldown.
At the top-level, you’ll see column for your 1 and 3 Year Goals (from Administration >>Meeting Settings >> 1 and 3 Year Goals tab) as well as an automatically-added column called “Other” where you’ll find Rocks not tied to any 1 and 3 Year Goal.
PRO TIP: Watch for Rocks in that “Other” column that are not tied to a specific corporate 1 and 3 Year Goal. These can often end up being “pet Rocks” and a drain on organizational resources. That’s why everything in GoExpand is tied upwards to a corporate 1 and 3 Year Goal. We’ll get there a lot faster if we’re all rowing in the same direction.
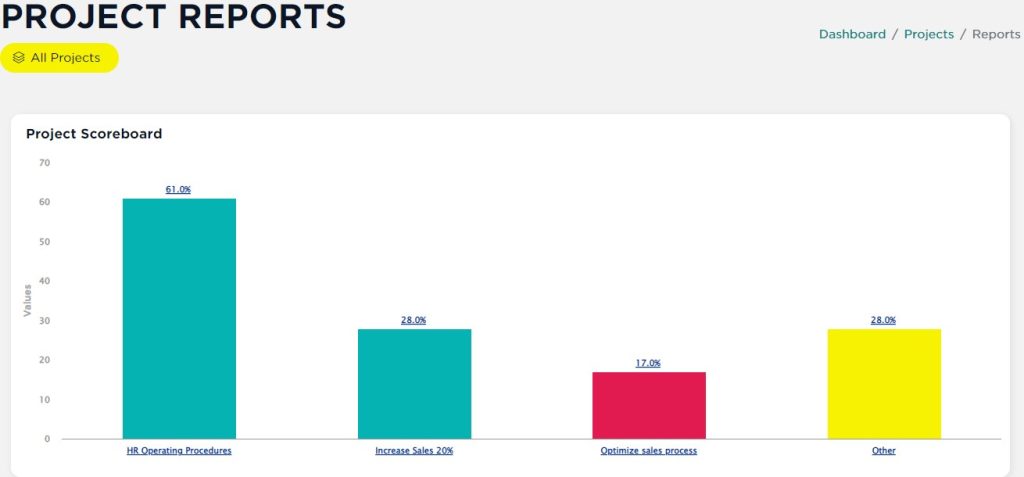
Click one of the columns and drilldown into the projects tied to that 1 and 3 Year Goal. Click on a project column to drilldown into the status of each of the tasks within that project. At the top, you’ll find “breadcrumbs” so you can navigate back out of the drilldown and drilldown again from elsewhere.
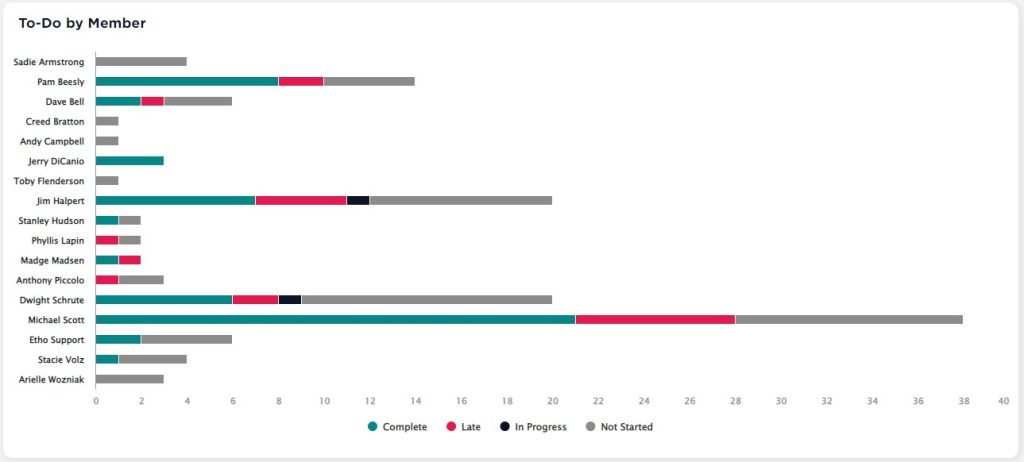
To-Dos by Members
Below the Rock ScoreBoard, you’ll find bar chart showing the count of To-Dos by team member over a 90-day period categorized by their status: Complete, Late, In Progress, or Not Started. That 90-day default period extends 45 days in the past and 45 days into the future.
This chart is a great way of getting a feel for your team’s bandwidth. Click a status in the legend below the chart to toggle on or off To-Dos in that status in the chart above. This can be a great way to also resource plan and reassign To-Dos as needed.
Love Charts?
If you like interactive charts like this, you’ll love Visualize Rocks.


