Performance Metrics come in two flavors: Numeric and Scale. Numeric Metrics are, well, numeric, measurable things. Scale Metrics are a little more subjective. For advanced users, GoExpand also offers “Smart Metrics.” You’ll find these “smart” options under Advanced Settings on the Metric Creation and Metric Editing views.
Selecting one or several of these advanced settings for an Metric, changes slightly how they look on the Metric tab.
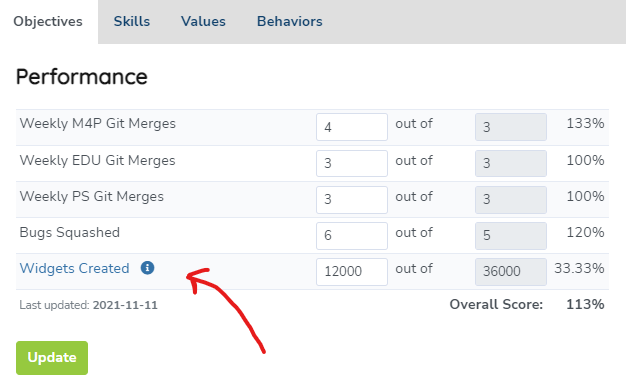
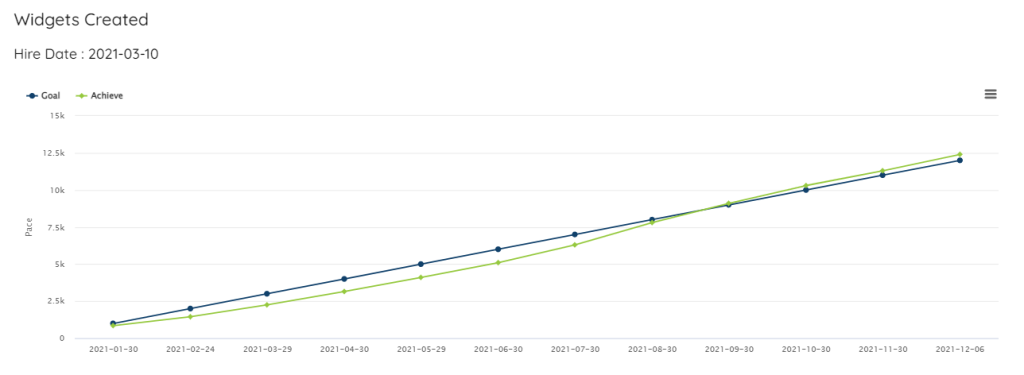
You’ll see these Smart Metrics have their titles linked. Clicking the title takes you to a breakdown of the progress towards that Metric with a chart as well as an exportable table.
As we dig in to each of these Advanced Settings for Metrics, we’ll use the same analogy of an individual Metric to create 36,500 widgets per year.
Let’s go!
Rollover Remainder
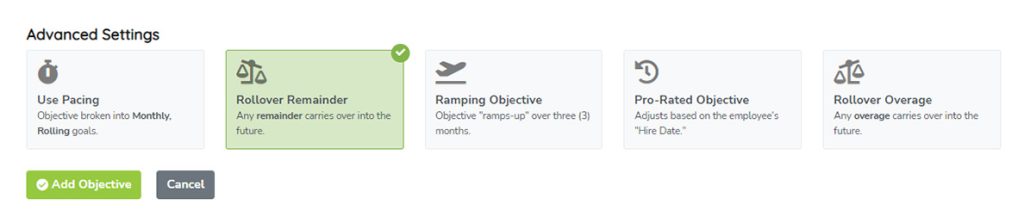
Metrics with Rollover Remainder selected will add any unachieved Core Value to the future. For example, if we want to create 36,500 widgets per year and we only managed to create 36,000 widgets last year. Then, this year’s Metric would be 37,000 widgets in that year (36,500 + 500).
Ramping Metric
Ramping Metrics create an automatic “ramp-up” period over the first three (3) months which still totals to our original Metric. So, if we want 36,500 widgets this year, that’s 100 widgets per month. With Ramping Metrics, we don’t assume we can hit that first target of 100 widget starting in January. This Smart Metric would start off with one-third of the monthly Metric the first month, then 2/3rds the second month, 100 widgets the third month (that’s 3/3rds, if you’re counting). Finally, it will split the missing widgets over the remaining 9 months. In this case, the monthly target would be about 101 widgets per month for the rest of the year.
| Month | Ramped Target |
|---|---|
| Month 1 | 33 |
| Month 2 | 66 |
| Month 3 | 100 |
| Month 4 | 101 |
| Month 5-12 | 101 |
Pro-Rated Metric

There are times when you’ll need to Pro-Rate an Metric based on an employee’s hire date. For example, if we hired Bob half-way through the year, he can’t be expected to hit his 12-month goal of 36,500 widgets in just 6 months. Select this option to “Pro-Rate” the Metric and it would automatically cut that Metric in half for Bob. If he was hired 3/4ths of the way through the year, this option would automatically cut his yearly Metric in 3/4ths–until next year.
Rollover Overage
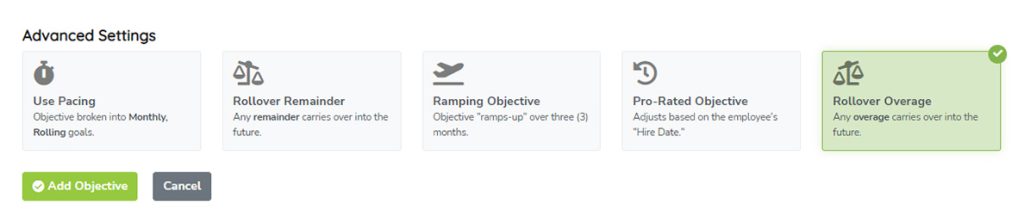
By default, if an employee exceeds a monthly Metric one month, that excess does NOT carry over to the next month. For example, if Bob makes 150 widgets in January, his goal for February is still 100 widgets. That overage doesn’t carryover by default.
If you want overages to carryover to future periods, select “Rollover Overage.”
To use our example from before, if the goal is to create 36,500 widgets per year, and Bob creates 37,000 widgets (500 extra), his Metric next year would be automatically 36,000 (500 fewer widgets).
Don’t confuse Rollover Overage with Rollover Remainder. The former passes the excess forward. The latter passes the shortfall forward. However, you can see how these Smart Metrics could be combined. In fact, they can.
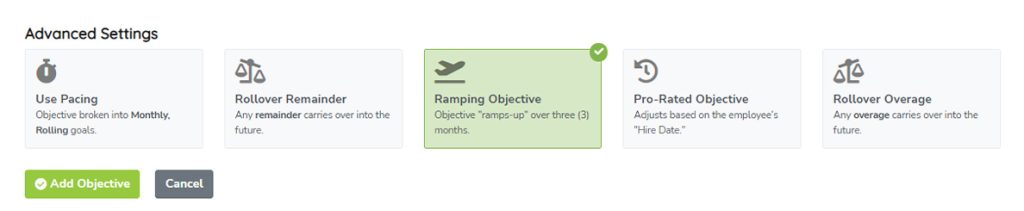
Combo
Wouldn’t it be great if these advanced Metric settings could be combined? Well, they can. We don’t call them Smart Metrics for nothing.
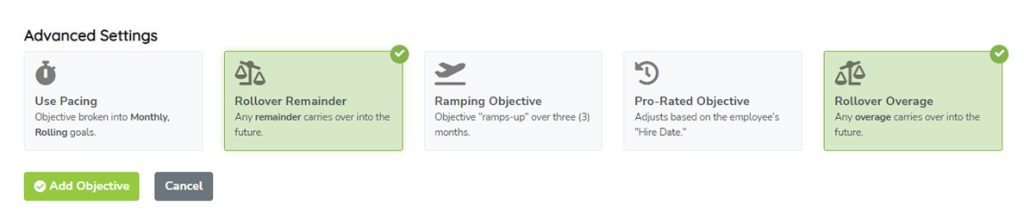
If, as shown in the screenshot above, we selected BOTH Rollover Remainder and Overage, then the extra would carry over to future periods as well as any losses carrying over. That’s a little like Pacing. Let’s talk about that next.
Pacing (Advanced)
The most complex to explain is Pacing, but it’s also the coolest, which is why we saved it for last.
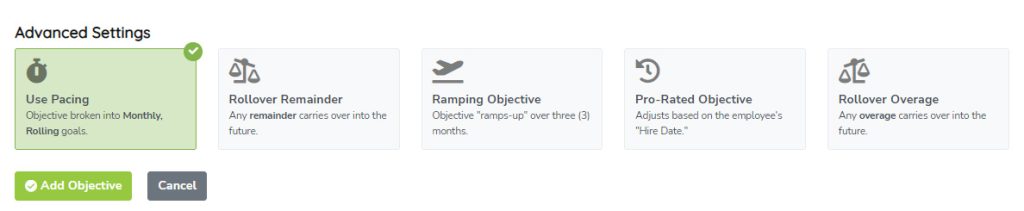
“Pacing” is a concept where we automatically calculate how a person is doing based on a (in this case yearly) goal that’s broken down into months (divided by 12) with the numerator being what they’ve accomplished over a rolling target which adds up to the Yearly goal at the end of the 12-month cycle.
Using our example before of a yearly goal of 36,500 widgets created, we can divide that value by 12 to get a monthly target of $3,042. Now, let’s pretend Bob doesn’t always hit his monthly goal, but ends the year over his yearly goal. If this was a “Paced” Smart Metric, it may look something like this.
| Month | Pace Goal | Achieved | Total Achieved | Pace |
|---|---|---|---|---|
| 1 | $3,042 | $3,222 | $3,222 | 105.93% |
| 2 | $6,083 | $2,227 | $5,449 | 89.57% |
| 3 | $9,125 | $2,793 | $8,242 | 90.32% |
| 4 | $12,167 | $5,282 | $13,524 | 111.16% |
| 5 | $15,208 | $4,875 | $18,399 | 120.98% |
| 6 | $18,250 | $1,924 | $20,323 | 111.36% |
| 7 | $21,292 | $2,495 | $22,818 | 107.17% |
| 8 | $24,333 | $4,523 | $27,341 | 112.36% |
| 9 | $27,375 | $1,590 | $28,931 | 105.68% |
| 10 | $30,417 | $5,180 | $34,111 | 112.15% |
| 11 | $33,458 | $4,312 | $38,423 | 114.84% |
| 12 | $36,500 | $2,119 | $40,542 | 111.07% |
You’ll see in months 2 and 3, Bob was below his monthly target, and behind the pace. However, once he got to month 4, he was adequately ahead of the goal that it didn’t even matter that months 6, 9, and 12 he was well-below his monthly target for widgets created.


