If enabled in your user Seat, you will have the option to “Visualize” Rocks. This pulls up an interactive Gantt chart.
NOTE: If no 1 and 3 Year Goals are present in Administration >> Meeting Settings >> 1 and 3 Year Goals tab, then “Visualize” is not an option in the main navigation.
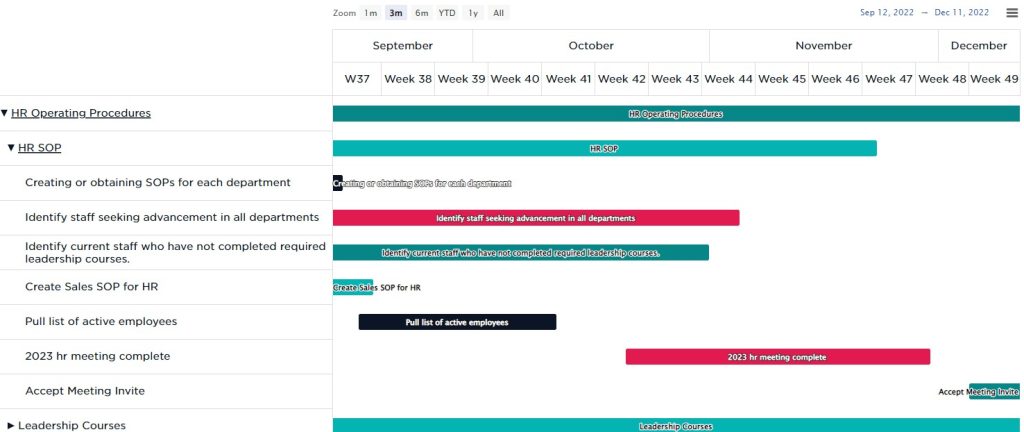
A Gantt chart, commonly used in Rock management, is one of the most popular and useful ways of showing 1 and 3 Year Goals, Rocks, and To-Dos displayed against time. On the left of the chart is a collapsible list of 1 and 3 Year Goals, Rocks, and To-Dos and along the top is a time scale.
Each activity is represented by a bar; the position and length of the bar reflects the start date, duration and end date of the activity. There is a vertical line representing the current date (today). Each bar gets darker as its progress towards 100% increases.
This allows you to see at a glance:
- What the various activities are
- When each activity begins and ends
- How long each activity is scheduled to last
- Where activities overlap with other activities, and by how much
- The start and end date of the whole Rock
All high-level 1 and 3 Year Goals are open by default. Each Rock within that 1 and 3 Year Goal is collapsed by default. Click the Rock name on the left to expand it into each of the To-Dos associated with that Rock.
Navigate across time at the bottom and zoom in or out to change how you’re viewing the chart. At the top-right, you have a few options for exporting. At the very bottom, there is a grey button to export the chart, in its current view, as a PDF.
You can drag & drop each Rock or To-Do to change its start and end dates. Grabbing the ends and dragging them will also update that To-Do or Rocks dates.
Love Charts?
If you like interactive charts like this, you’ll love our Rock Reports too.


