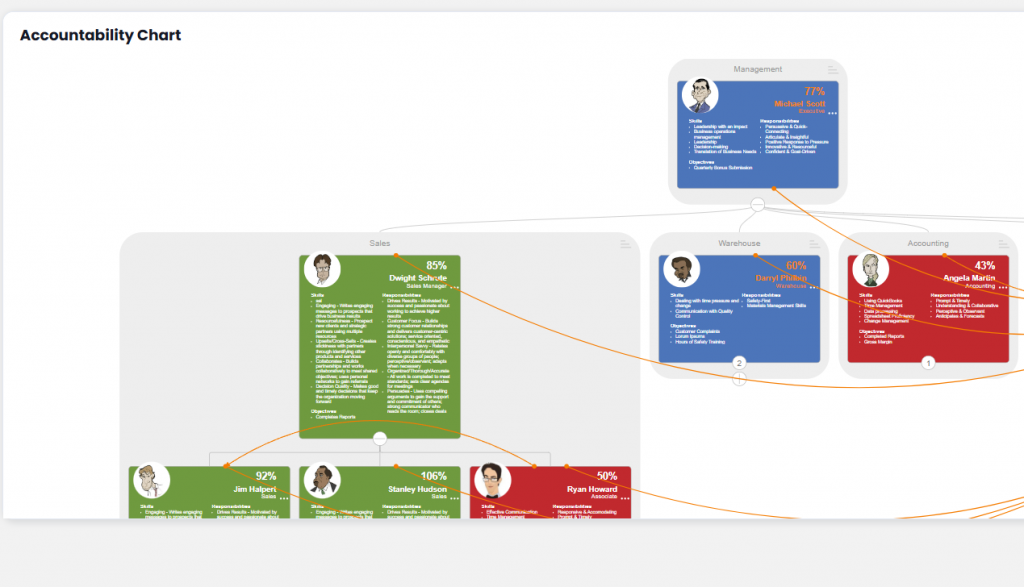
The Accountability Chart displays your company’s hierarchy in the form of user tiles color-coded by performance score or alignment score for the previous 30 days. The Accountability Charts is fully interactive, allowing users with the correct permissions to create or edit users and their roles. Employee tiles can also be moved to change department and/or reporting structure on the fly.
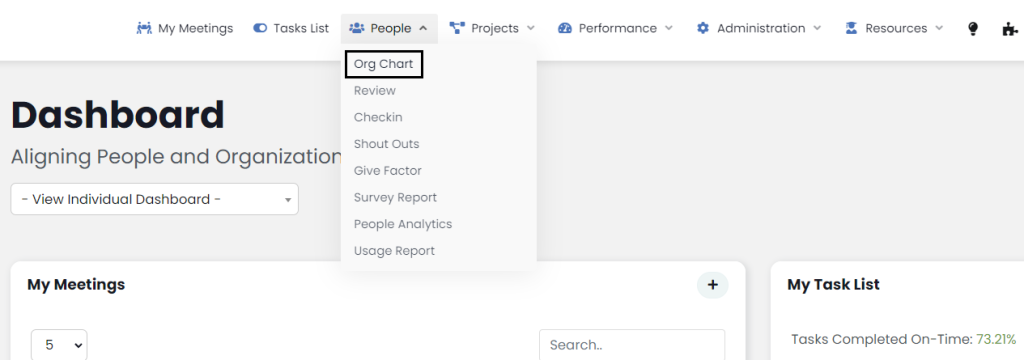
Access the Accountability Charts from the navigation panel by selecting People >> Accountability Charts.
The default Accountability Charts will display the logged-in user and all users that report to them, primarily and secondarily. Primary reporting lines are grey, and secondary reporting lines are orange. If your organization has departments, the Accountability Charts will group employees in those departments on the chart. To view the Accountability Charts based on user alignment select “Alignment” at the top right corner next to the default “Performance” pill. To change the users displayed on the Accountability Charts, either select the dropdown in the top left of the page and select a new employee, or select the + symbol underneath an employee to expand the chart further. Performance and alignment scores from other places in Performance Scoring determine the tile colors. Blue is a non-scored user, green is a high performing user, yellow is a medium performing user and red is a low performing user.
Moving Users
In the event an existing user needs to move within your organization, the Accountability Charts can be used to update reporting structure and/or department by dragging the user’s tile and dropping it on the tile of the new manager.
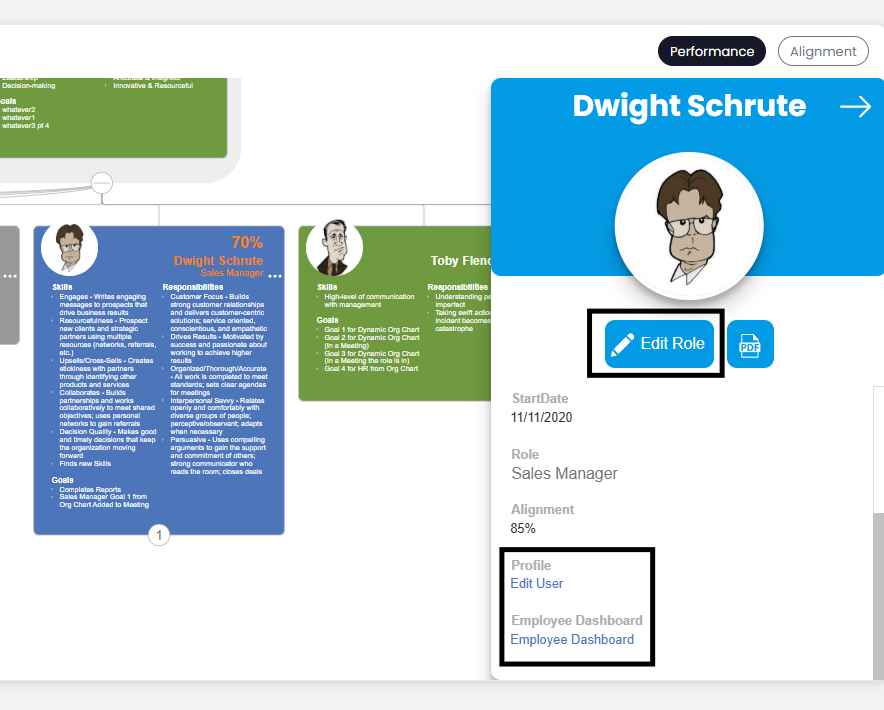
Employee Slide-Out Panel
Clicking a user tile activates a slide-out panel that gives users with the correct permissions the ability to edit the Role, edit the User, and access their Employee Dashboard.
Adding/Editing Users and Roles
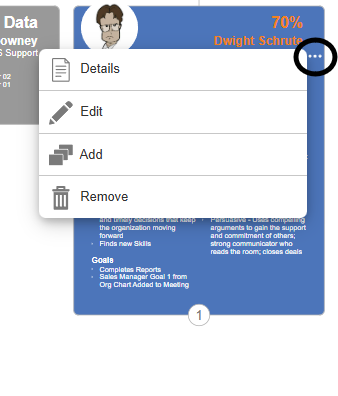
Clicking the three dots next to the Role description in a tile opens an options modal allowing users to do the following:
- Details – view the user details slide-out pane.
- Edit – edit the user or their role.
- Add – add a new user who reports to the selected user.
- Remove – delete the selected user.
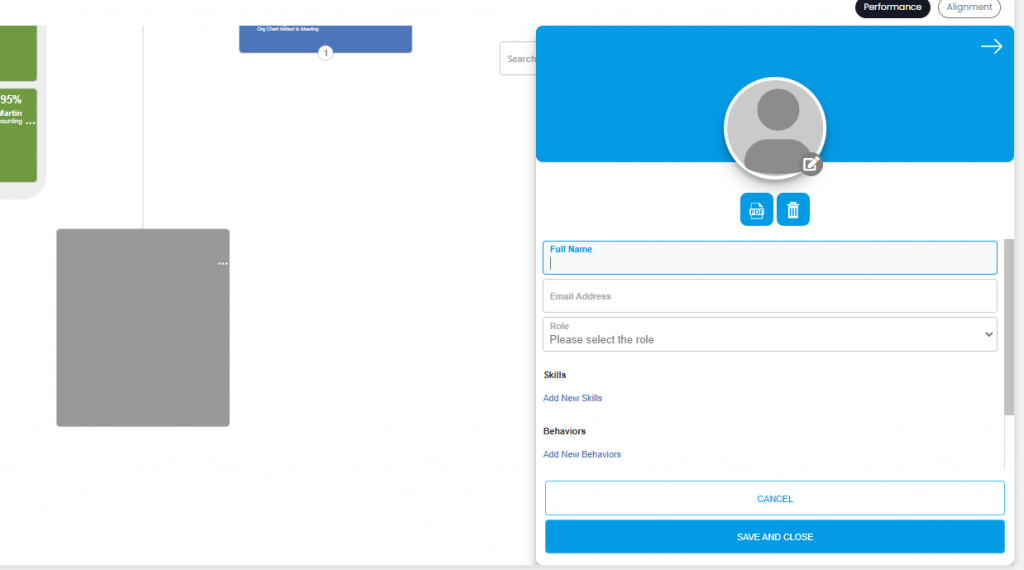
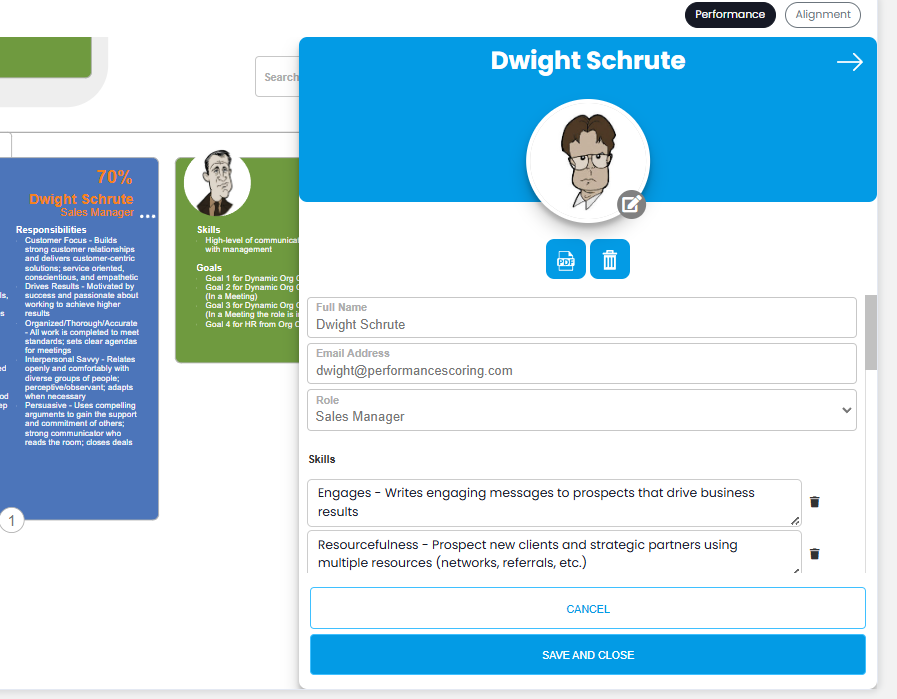
Adding a new user will create a blank tile which can then be edited by selecting the three dots and choosing Edit. This will cause a blank slide-out to appear. Upload a user picture by clicking the edit icon next to the blank avatar. Enter the new user full name and email address, then select the appropriate role from the drop-down menu. Once a role is selected, the Behaviors, Skills, and Goals for that Role will automatically populate. When you are done, select Save and Close, and the new user will have been created in your organization.
Using the Edit function allows you to update the role information as well as the user’s profile picture.
What about the future of the organization? That’s what the aptly named, “Future Accountability Chart” is all about.


